Growth tab — traffic, conversion, and attribution
The Growth tab in Marketplace Insights shows how buyers find the marketplace, where they drop off during purchase, and how returning customers and referrers contribute to sales. Session-based traffic and conversion widgets sit alongside returning-customer and referrer attribution metrics.
Your AppInsights header may list additional entries (for example Leads) depending on marketplace configuration. The widgets below appear on Growth in Marketplace Insights.
Widgets on Growth
| Widget | What it shows |
|---|---|
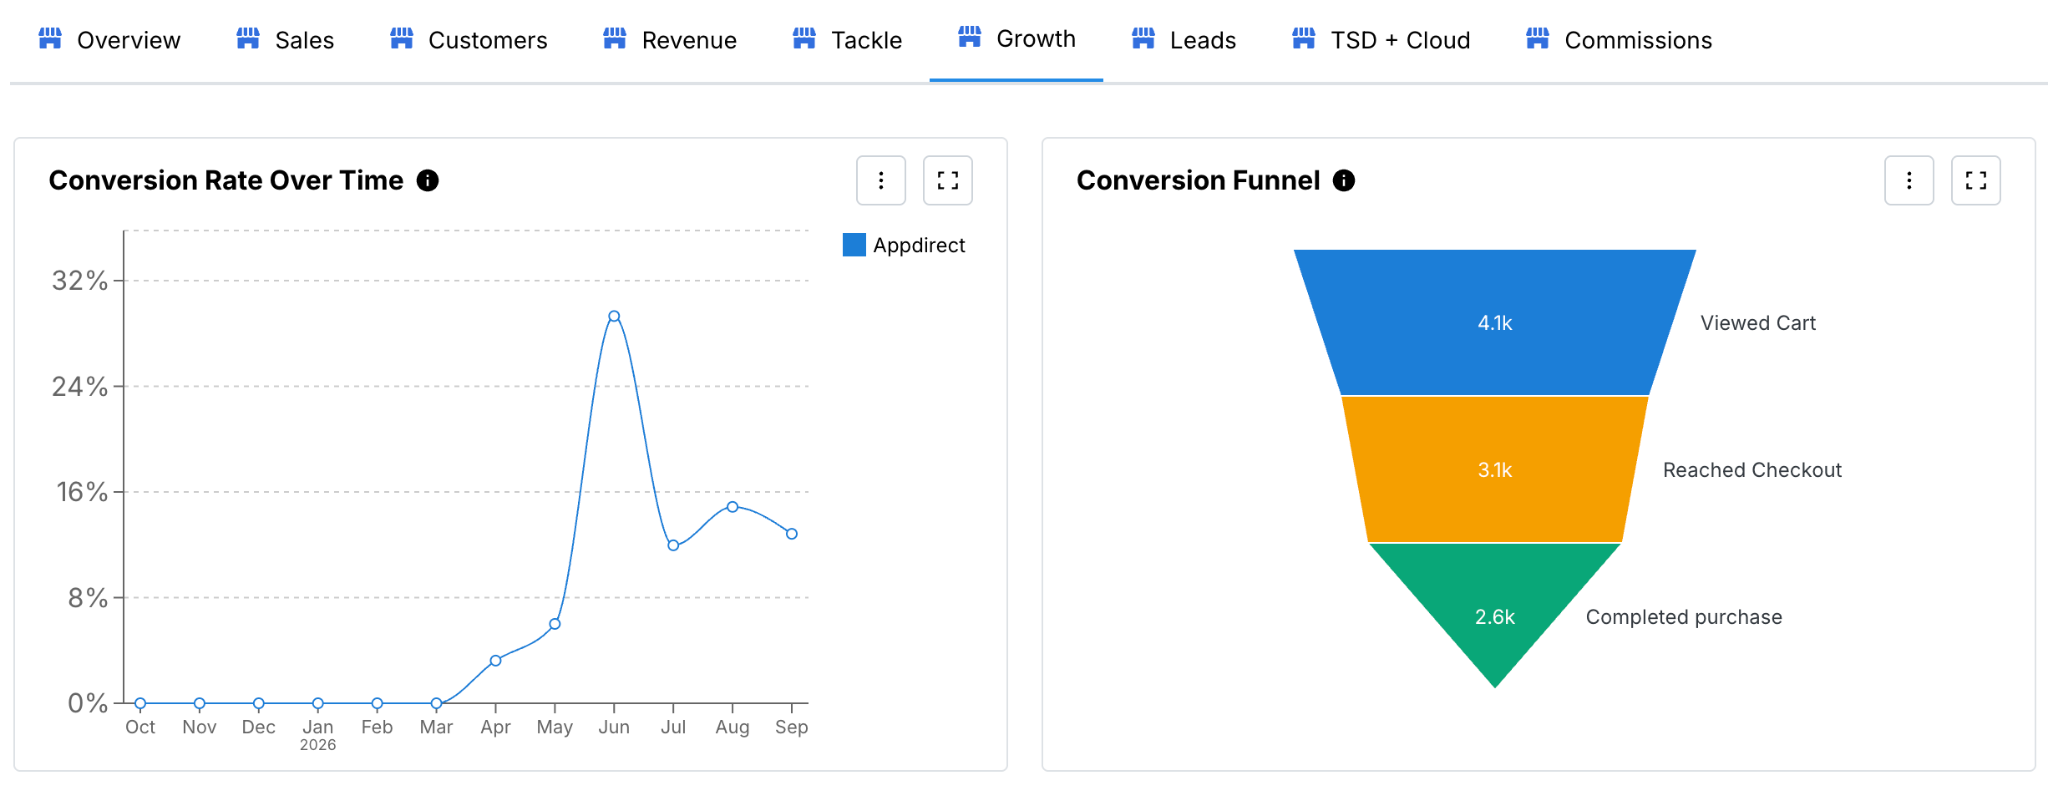
| Conversion rate over time | Conversion rate trend over months |
| Conversion funnel | Funnel from Viewed cart → Reached checkout → Completed purchase |
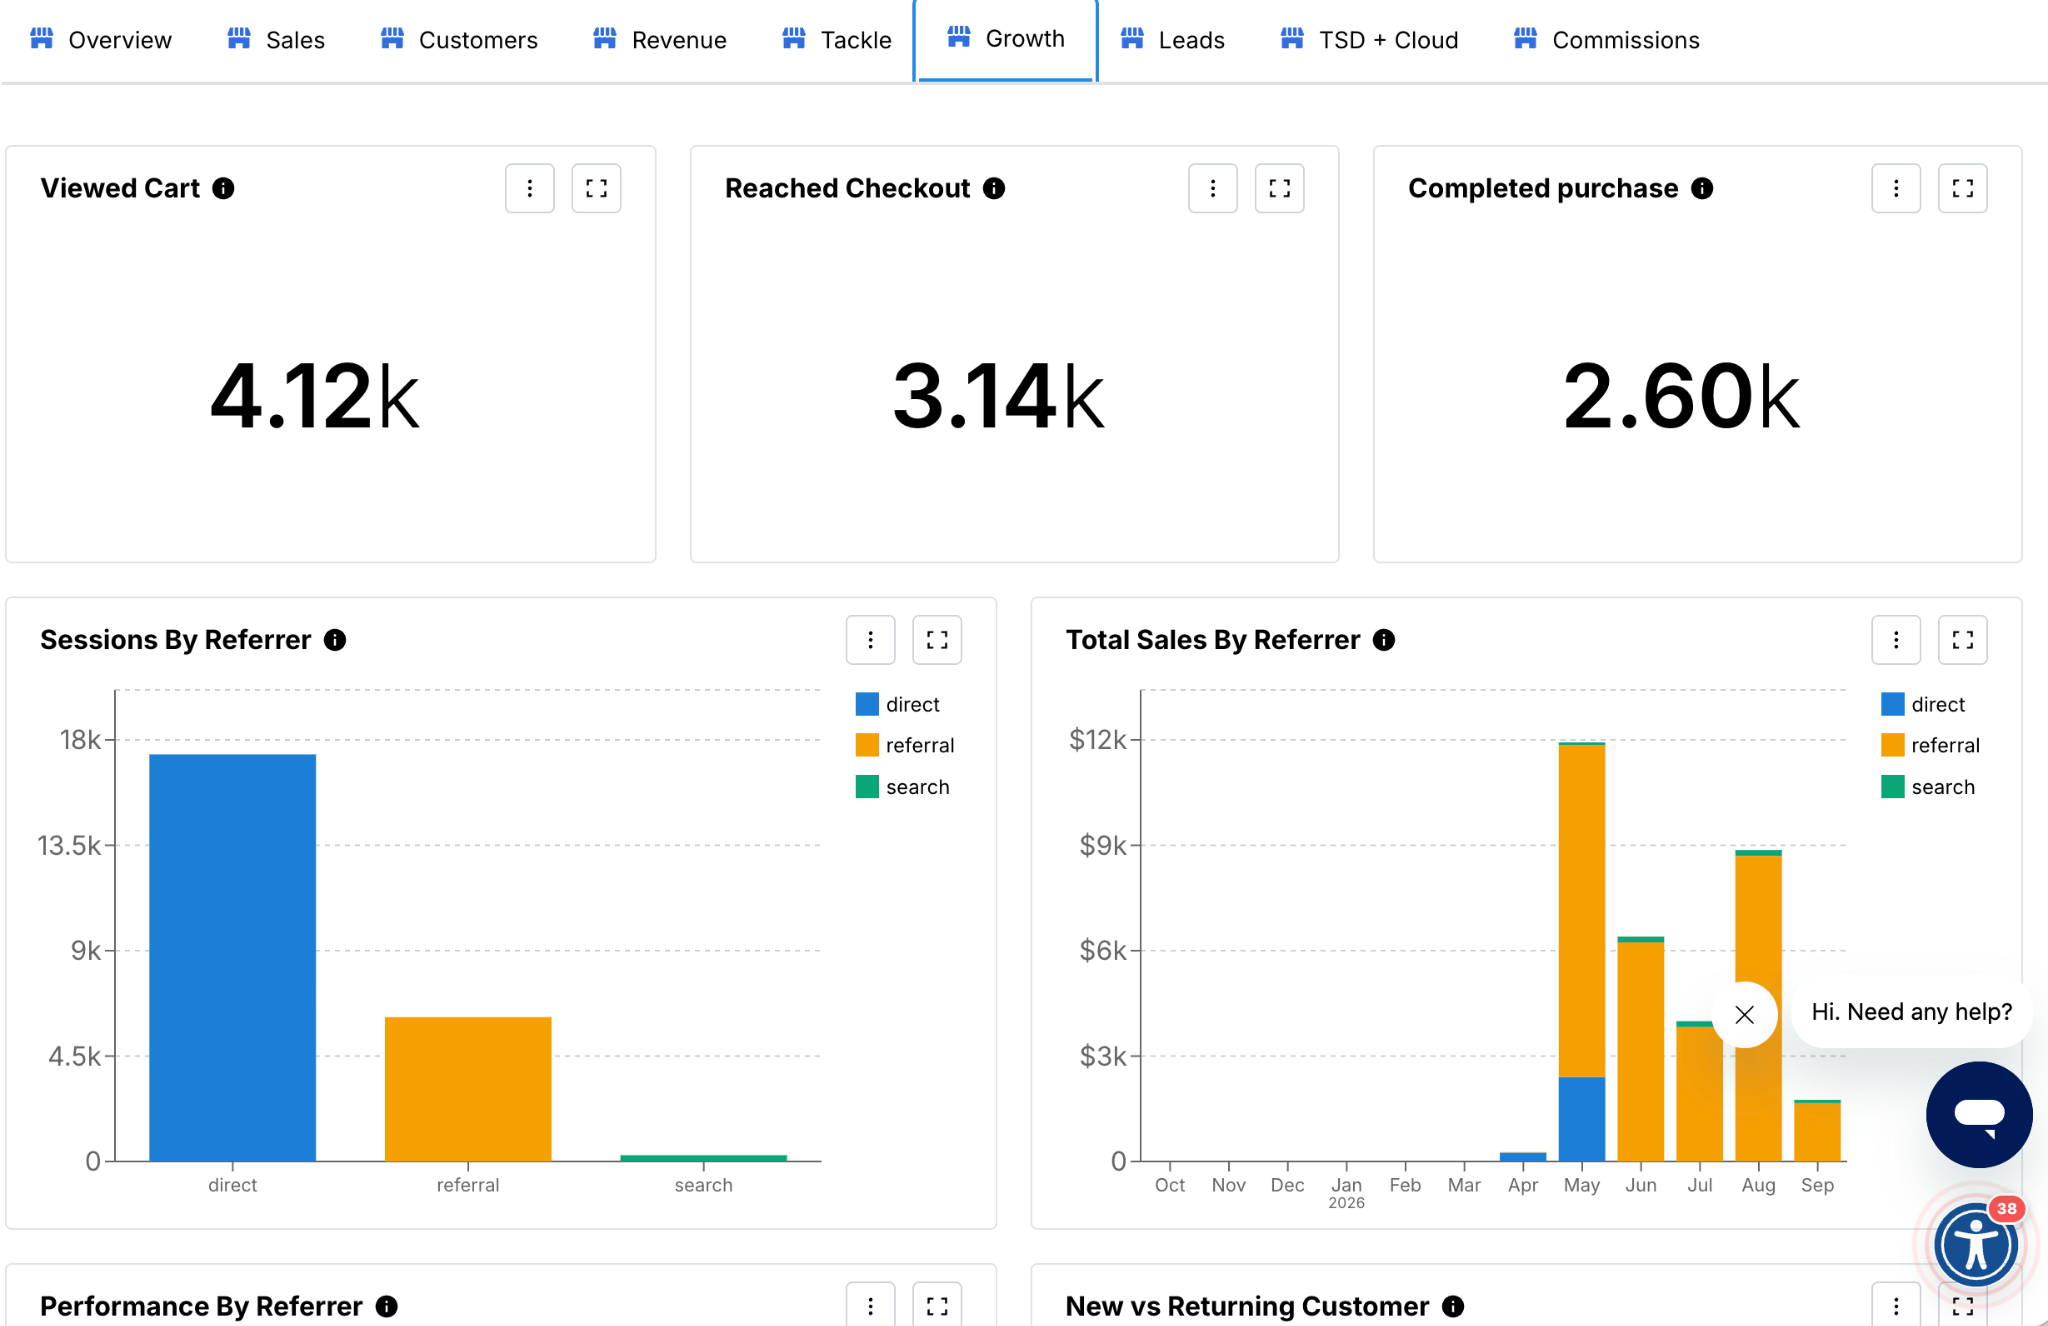
| Viewed cart | Count of sessions that viewed the cart |
| Reached checkout | Count of sessions that reached checkout |
| Completed purchase | Count of sessions that completed purchase |
| Sessions by referrer | Session volume by traffic source (for example direct, referral, search) |
| Total sales by referrer | Sales attributed to referrer over time (stacked by source) |
| Performance by referrer | Combined sessions, orders, and sales by referrer (when present on the tab) |
| New vs Returning Customer | Split of new versus returning customers (when present on the tab) |
Your marketplace may also show sessions over time, sessions by landing page, sessions by device type, total sales by social referrer, and performance by referring channel on Growth.
When to use this tab
Use Growth to monitor acquisition and checkout funnel health, compare referrers and landing pages, and see whether sales come from new or returning customers.
Related topics
Was this page helpful?
Tell us more…
Help us improve our content. Responses are anonymous.
Thanks
We appreciate your feedback!