Create custom insights
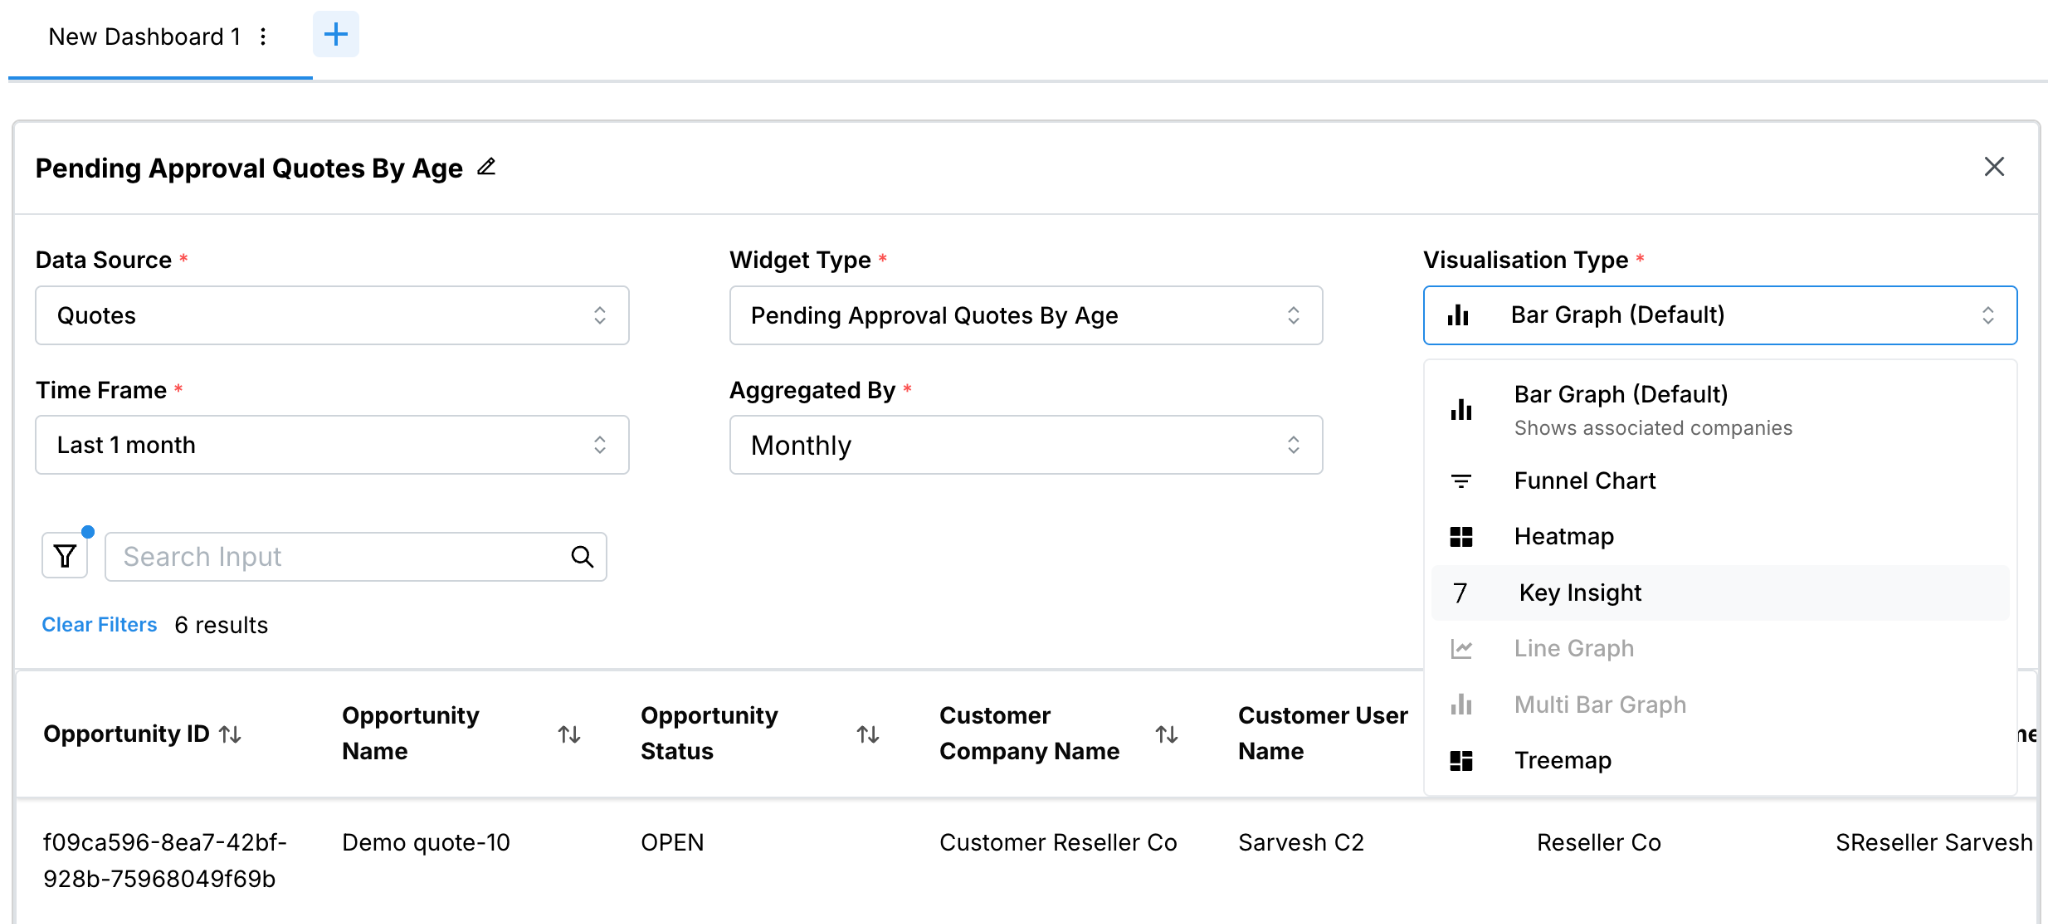
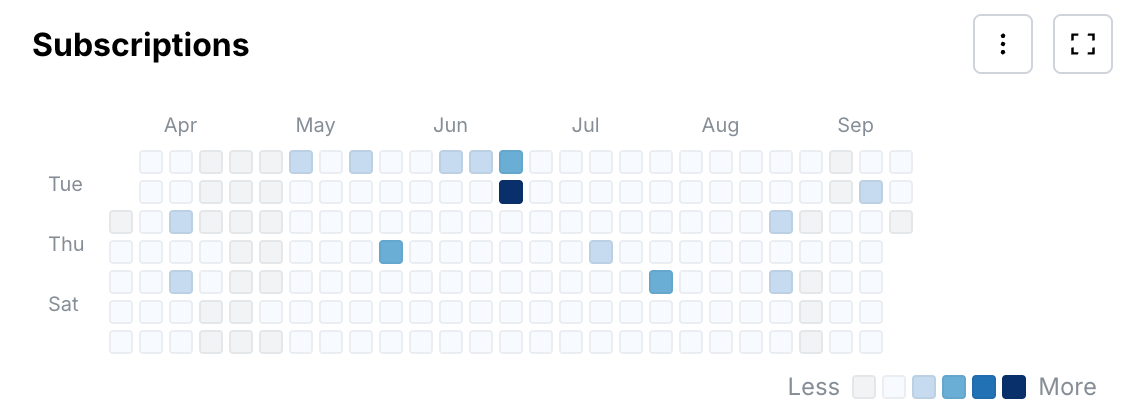
Users who can create custom AppInsights visualizations choose a data source first, then configure the measure and chart type for that source. Heatmap, Treemap, and Funnel visualizations are available in the builder in addition to table, bar, line, and pie charts.
Availability of data sources (for example Orders, Quotes, Subscriptions, Commissions, Revenue, Users, Invoices, or Companies) depends on your role.
Creation flow
- Choose a data source.
- Configure the measure. The Widget Type list appears only after you select a data source and lists metrics for that source.
- Choose a visualization, including Heatmap, Treemap, or Funnel where supported.
- Set fields, group-by, and filters, then save the visualization.
| Visualization type | Typical default aggregation |
|---|---|
| Heatmap | Daily |
| Treemap | Monthly |
| Funnel | Monthly |
Developer-only users cannot create custom visualizations. Users who also hold Marketplace Manager, Reseller, or Reseller Manager access can create custom visualizations for those roles.
Related topics
Was this page helpful?
Tell us more…
Help us improve our content. Responses are anonymous.
Thanks
We appreciate your feedback!