Use AppInsights
Insights is an advanced data visualization tool designed exclusively for Advisor Services. It empowers you to effectively track critical KPIs that impact your businesses, ensuring informed decision-making and strategic growth.
Key features
- Data visualization: You can visualize your data through intuitive dashboards, making it easier to identify trends and insights at a glance. You can also drill down the widgets to view the underlying data within Insights.
- KPI tracking: Monitor essential KPIs relevant to your business, allowing for proactive adjustments and enhanced performance.
- User-friendly interface: The dashboard environment is designed for ease of use, enabling users to gather data effortlessly.
Prerequisites
Before using AppInsights, ensure that the following prerequisites are met:
- You must hold an eligible Marketplace role (see the role table below). AppInsights is a native Marketplace capability; AppInsights product assignment is no longer required.
- Depending on your role, a default set of dashboards and widgets are available on AppInsights.
- A self-serve marketplace manager user must have at least 10 subscriptions to see the AppInsights dashboards. This is applicable for the Self-serve Marketplaces only.
Accessing AppInsights
- Sign in to the marketplace.
- Click the AppInsights icon in the Marketplace top navigation.
📝 Note: The AppInsights icon appears in the Marketplace top navigation when the marketplace uses the universal header with the latest theme. In marketplaces that use the universal header with an older theme, the icon may not be displayed. Users with an eligible role can still access AppInsights at
/insights/appuntil the marketplace navigation theme is updated.
For more information about this change, see Integrating AppInsights as a native capability.
Important notes
- AppInsights is only available on prod.shared.use1 cluster (us-east-1) on:
- catalog.appdirect.com for advisors+company admins, company admins, and marketplace managers.
- Self-serve marketplaces for company admins, and marketplace managers (non-enterprise editions only).
The below table displays the role combinations and the dashboards and widgets available for each.
| Role Combination | Marketplace Insights (Dashboards) | Custom Insights (Widget Types) |
|---|---|---|
| Company Admin | Company Usage | N/A |
| Marketplace Manager | Commerce, Products & Orders, Revenue | For information on the available widgets for this role, see Marketplace Insights Dashboards and Widgets. |
| Marketplace Manager + Company Admin | Commerce, Products & Orders, Revenue, Company Usage | For information on the available widgets for this role combination, see Marketplace Insights Dashboards and Widgets. |
| Advisor + Company Admin | Provider Sales, Commissions, Subscriptions, Company Usage | For information on the available widgets for this role combination, see Marketplace Insights Dashboards and Widgets. |
| Marketplace Manager + Advisor + Company Admin | Commerce, Products & Orders, Revenue, Provider Sales, Commissions, Software Sales, Company Usage | For information on the available widgets for this role combination, see Marketplace Insights Dashboards and Widgets. |
| Reseller + Company Admin | Provider Sales, Commissions, Subscriptions, Company Usage; reseller operational dashboards where applicable | For information on the available widgets for this role combination, see Marketplace Insights Dashboards and Widgets. |
| Reseller | Commissions; orders, quotes, and subscriptions (reseller operational dashboards) | N/A. For more information, see AppInsights dashboard for Resellers and Reseller Managers. |
| Reseller Manager | Commissions; orders, quotes, and subscriptions (reseller operational dashboards with marketplace-level visibility) | N/A. For more information, see AppInsights dashboard for Resellers and Reseller Managers. |
| All Remaining Roles | N/A. Shown a page indicating they don’t have access to Insights | N/A |
-
Insights is only available in the US-shared production environment and only for advisor companies.
-
New filters and a data table have been introduced in the new experience. If you notice any discrepancies in custom insights created in the old experience, clear and reapply the filters to resolve the issue. For further assistance, contact your AppDirect representative.
-
Upon migration to the new experience, widget positions are sorted based on their addition date. If you notice any changes in positioning, you can either create a new view or contact your AppDirect representative.
-
Insights widgets display data for the past 12 months in the default dashboards/ market insights. The maximum data visualization limit in custom insights is 3 years, excluding the current month. For more historical data, generate a report or contact your AppDirect representative.The data displayed in default and custom insights is the latest up to the previous day.
-
Orders, Quotes, and Tickets that have no Advisor ID, Location ID, Product ID, and Provider ID are invalid. They might be visible in Provider Sales but won’t be in Insights.
-
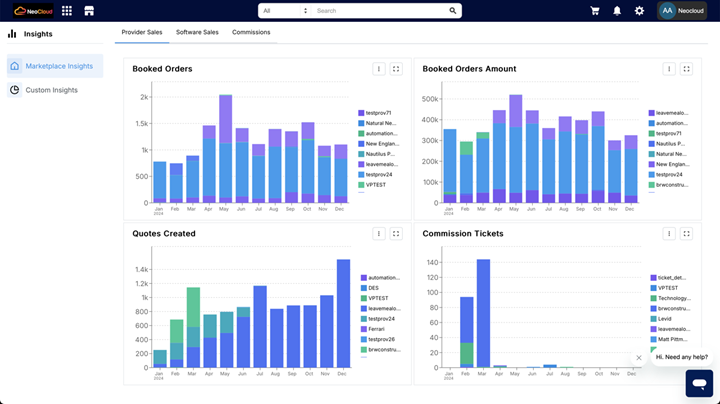
The Bar Graph widgets for an L1 advisor will display data for both their company and all associated L2 companies. All other widgets will only show data for the advisor’s own company.
-
Marketplace Managers are designated as Company Admins by default and may hold multiple additional roles, like Reseller. Role-specific icons are displayed to clarify the level of data available in each Marketplace Insights dashboard title. These icons help Marketplace Managers easily understand the scope of data accessible within each dashboard.
-
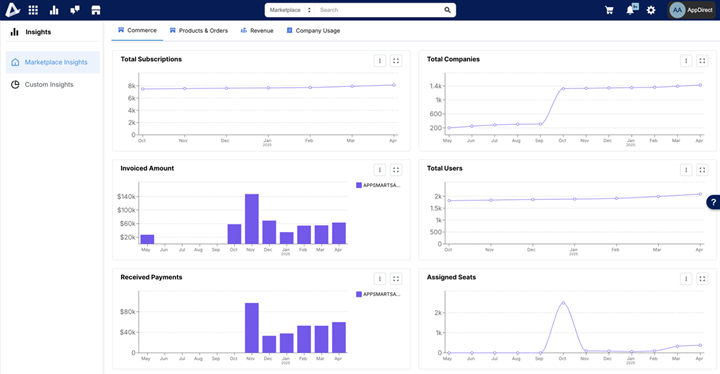
Advisors are not granted Marketplace Manager (MM) access on catalog.appdirect.com. Provider Sales is not available on self-serve marketplaces. Also, L1/L2 hierarchy is not applicable for Marketplace Managers. As a result, Marketplace Managers will not see any hierarchy in their visualizations.
View for an Advisor L1 company:
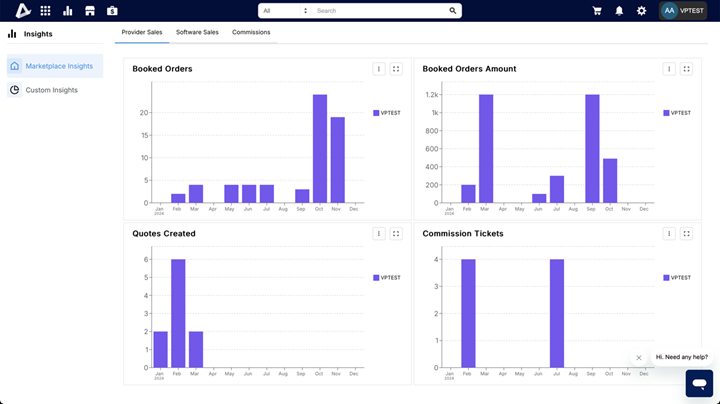
View for an Advisor L2 company:
View for a Marketplace Manger:
-
To maintain clarity and readability in the visualization, an 'Others' bar is used. This bar groups less prominent data points when the number of items exceeds a certain threshold in the stacked bar graph. This ensures that the chart highlights the most important information while still representing all data. The threshold for grouping items into the 'Others' bar adjusts dynamically based on the total number of items.
Interface walkthrough
Users are welcomed with a user-friendly interface designed for easy navigation and data analysis through dashboards.
Insights dashboards
Dashboards serve as the primary interface for visualizing your data within AppInsights. They provide an organized and intuitive way to display key metrics and insights.
Marketplace Insights dashboard
- Upon accessing AppInsights, Advisors are provisioned with three default dashboards: Provider Sales, Commissions, and Software Sales.
- These dashboards require no user action to set up.
- Default dashboards can be found under the Marketplace Insights folder, which is also the landing folder when you visit AppInsights.
To access marketplace insights
-
Click the AppInsights icon in the Marketplace top navigation.
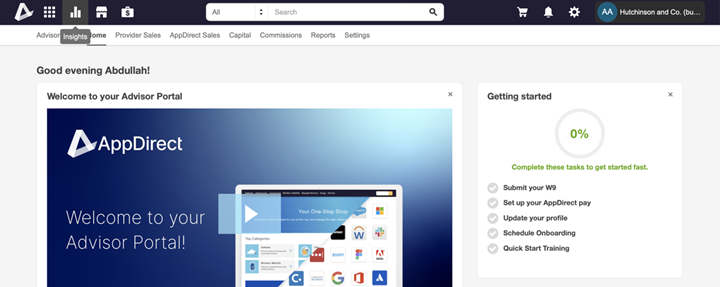
The deafult dashboard screen appears.
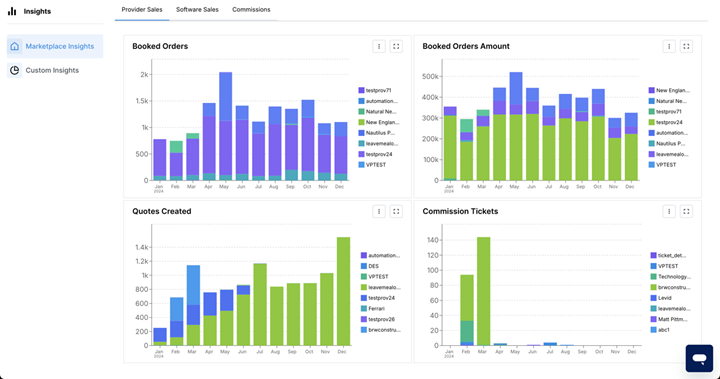
Marketplace Insights Dashboards and Widgets
The below table displays the list of default dashboards for all role combinations:
| Role | Dashboard | Exclusive to catalog.appdirect. com | Widget | What does it show? |
|---|---|---|---|---|
| Advisor + Company Admin | Provider Sales | Yes | Booked Orders | Number of orders per month for the past 12 months for the advisor company. |
| Advisor + Company Admin | Provider Sales | Yes | Booked Order Amount | Order amount per month for the past 12 months for the advisor company. |
| Advisor + Company Admin | Provider Sales | Yes | Quotes Created | Number of quotes per month for the past 12 months for the advisor company. |
| Advisor + Company Admin | Provider Sales | Yes | Tickets Created | Number of tickets per month for Commissions and Elite Commissions departments for the past 12 months for the advisor company. |
| Advisor + Company Admin | Commissions 📝 Note: This Dashboard is available for L2 advisors only. | Yes | Commissions | Total commissions (amount) per month for the past 12 months for the advisor company. |
| Advisor + Company Admin | Software Sales | Yes | Subscriptions | Number of newly created orders per month for the past 12 months for the advisor company. |
| Advisor + Company Admin | Software Sales | Yes | Subscriptions Pending Provisioning | Number of newly created orders (subscriptions) with status = Initialized, per month for the past 12 months for the advisor company. |
| Marketplace Manager | Commerce | No | Total Subscriptions | Subscription amount growth for the past 12 months on the marketplace. Data point for a month = This month’s data + cumulative data until this month For example, Jan Value = 100, Feb Value = 50, Mar Value = 60 The graph will show Jan, Feb, Mar as 100, 150, 210 |
| Marketplace Manager | Commerce | No | Total Companies | Company growth for the past 12 months on the marketplace. Data point for a month = This month’s data + cumulative data until this month For example, Jan Value = 100, Feb Value = 50, Mar Value = 60 The graph will show Jan, Feb, Mar as 100, 150, 210 |
| Marketplace Manager | Commerce | No | Total Users | User growth for the past 12 months on the marketplace. Data point for a month = This month’s data + cumulative data until this month For example, Jan Value = 100, Feb Value = 50, Mar Value = 60 The graph will show Jan, Feb, Mar as 100, 150, 210 |
| Marketplace Manager | Commerce | No | Invoiced Amount | Invoice amount per month for the past 12 months on the marketplace. |
| Marketplace Manager | Commerce | No | Received Payments | Received amount per month for the past 12 months on the marketplace. |
| Marketplace Manager | Commerce | No | Assigned Seats | Number of assigned seats per month for the past 12 months on the marketplace. |
| Marketplace Manager | Products & Orders | No | New Order Volume | Newly created order amount by company per month for the past 12 months on the marketplace. Data point for a month = A month’s data |
| Marketplace Manager | Products & Orders | No | New Companies | Number of newly created companies per month for the past 12 months on the marketplace. Data point for a month = A month’s data |
| Marketplace Manager | Products & Orders | No | Best Performing Products (total $) | Top 5 products by total sales volume in the past 12 months on the marketplace. |
| Marketplace Manager | Products & Orders | No | Worst Performing Products (total $) | Bottom 5 products by total sales volume in the past 12 months on the marketplace. |
| Marketplace Manager | Revenue | No | Recurring Revenue per user (Monthly average) | Monthly recurring revenue / total # of users for the past 12 months for the reseller companies on the marketplace. 📝 Note: ‘Advisor'=‘Reseller’ on every marketplace apart from AppDirect Marketplace. |
| Marketplace Manager | Revenue | No | Recurring Revenue per company (Monthly average) | Monthly recurring revenue / total # of companies for the past 12 months for the reseller companies on the marketplace. 📝 Note: ‘Advisor'=‘Reseller’ on every marketplace apart from AppDirect Marketplace. |
| Marketplace Manager | Revenue | No | New One Time Revenue for Advisor Companies | Newly created order amount per month for the past 12 months for the reseller companies on the marketplace. Data point for a month = A month’s data 📝 Note: 'Advisor'=‘Reseller’ on every marketplace apart from AppDirect Marketplace. |
| Company Admin | Company Usage | No | Spending by Product | Total spend on subscription services for the logged in user’s company per month for the past 12 months. 📝 Note: This does not include zero-dollar SKUs. |
| Company Admin | Company Usage | No | Unique Logins | Unique login count on the marketplace per month for the past 12 months. |
| Company Admin | Company Usage | No | Logins by Location | Logins on the marketplace displayed by location per month in the past 12 months. |
| Company Admin | Company Usage | No | Successful vs Failed Login Attempts | Successful and failed login attempts on the marketplace over the past 12 months. |
| Company Admin | Company Usage | No | Top Accessed Products | Top 10 accessed products by the logged in user’s company employees for the past 12 months. |
| Company Admin | Hardware | Yes | Orders Over Time | Total number of orders placed over time, broken down by order type and status. |
| Company Admin | Hardware | Yes | People by Status | Count of users grouped by their current status. |
| Company Admin | Hardware | Yes | Inventory by Status | Count of inventory assets grouped by their current status. |
Custom Insights dashboards
- Users can create Custom Dashboards tailored to their specific visualization needs.
- Custom Dashboards include various filters for enhanced granularity and understanding of analytics.
- Supported visualization types include:
- Line Graphs
- Bar Graphs
- Key Insights
To build custom insight dashboards
-
Click the AppInsights icon in the Marketplace top navigation. The default dashboards screen appears.
-
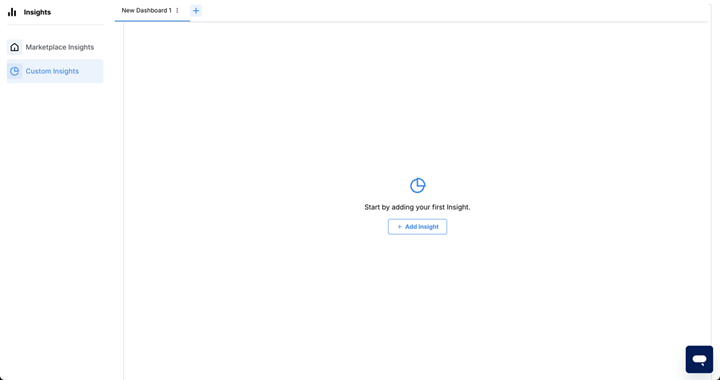
Click Custom Insights.
A new dashboard appears
-
Click Add Insight.
-
Select the Add Widget Type.
-
Select the Visualisation Type.
-
Click Show Insight.
-
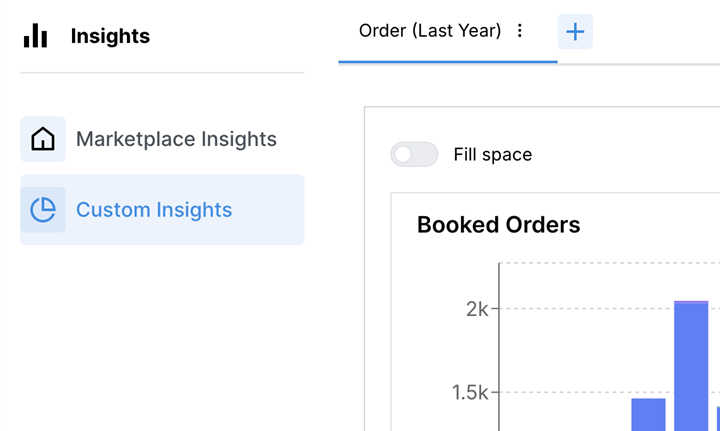
(optional) Click the '+' button next to your current dashboard to add more dashboards.
The below table displays the list of available Widgets and visualization types:
| Role | Widget | How can I visualize my data? | What does it show? |
|---|---|---|---|
| Advisor + Company Admin | Booked Orders | BAR GRAPH KEY INSIGHT LINE GRAPH | Number of orders per month for the past 12 months for the advisor company. |
| Advisor + Company Admin | Booked Order Amount | BAR GRAPH KEY INSIGHT LINE GRAPH | Order amount per month for the past 12 months for the advisor company. |
| Advisor + Company Admin | Quotes Created | BAR GRAPH KEY INSIGHT LINE GRAPH | Number of quotes per month for the past 12 months for the advisor company. |
| Advisor + Company Admin | Commission Tickets Created | BAR GRAPH KEY INSIGHT LINE GRAPH | Number of tickets per month for Commissions and Elite Commissions departments for the selected time period for the advisor company. |
| Advisor + Company Admin | Commission Tickets by Age (Count) | BAR GRAPH | Number of open commission tickets for Commissions and Elite Commissions departments bucketed by age. Buckets: <30, 31-90, >90 |
| Advisor + Company Admin | Commission Tickets by Provider | BAR GRAPH | Count of commission tickets by provider for Commissions and Elite Commissions departments for the advisor company for a time period. 📝 Note: Each commission ticket should be associated with a single provider. Having multiple providers linked to the same ticket is not expected behavior and may lead to data mismatches. If you encounter a ticket with multiple providers, please contact the Provider Sales team to correct the data at the source. |
| Advisor + Company Admin | Commission Tickets by Status | BAR GRAPH | Count of commission tickets by status for Commissions and Elite Commissions departments for the advisor company for a time period. |
| Advisor + Company Admin | Commission Tickets Open v/s Resolved | BAR GRAPH MULTI BAR GRAPH | Count of commission tickets with open and closed status for Commissions and Elite Commissions departments for the advisor company for a time period. |
| Advisor + Company Admin | Commissions by Provider 📝 Note: This widget is available for L2 advisors only. | BAR GRAPH | Commission amount (payout) for the advisor company grouped by provider for a time period. |
| Advisor + Company Admin | Provisioned Order Amount Pending Commissions | BAR GRAPH KEY INSIGHT LINE GRAPH | Order amount for orders provisioned pending commission for the advisor company for a time period. |
| Advisor + Company Admin | Provisioned Order Count Pending Commissions | BAR GRAPH KEY INSIGHT LINE GRAPH | Count of orders for orders provisioned pending commission for the advisor company for a time period. |
| Advisor + Company Admin | Net Billed 📝 Note: This widget is available for L2 advisors only. | BAR GRAPH KEY INSIGHT LINE GRAPH | Net billed amount for the advisor company for a time period. |
| Advisor + Company Admin | Booked Order amount by product category | BAR GRAPH | Booked order amount by product category for the advisor company for a time period. |
| Advisor + Company Admin | Booked Order amount by provider | BAR GRAPH | Booked order amount by provider for the advisor company for a time period. |
| Marketplace Manager | New Companies | BAR GRAPH KEY INSIGHT LINE GRAPH | Count of companies per month for the selected time period on the marketplace. |
| Marketplace Manager | New Subscriptions | BAR GRAPH KEY INSIGHT LINE GRAPH | Subscription amount per month for the selected time period on the marketplace. |
| Marketplace Manager | Invoiced Amount | BAR GRAPH KEY INSIGHT LINE GRAPH | Invoice amount per month for the selected time frame on the marketplace. |
| Marketplace Manager | New Users | BAR GRAPH KEY INSIGHT LINE GRAPH | Count of users per month for the selected time period on the marketplace. |
Key features and functions
Using Insights you can do the following:
- Visualize and filter data
- Set the time frame for which the insight is rendered
- Aggregate data by grouping the data within Insights
- View the underlying data within Insights
- Edit, rename and download insights
- Delete insights
- Expand the insight to fill the row
- Maximize a widget
- Delete entire dashboard
Visualization types
Currently, the following visualization types are supported:
- LINE GRAPH - Displays trends over time using connected data points. It is ideal to visualize continuous data and identify patterns or changes.
- BAR GRAPH - Represents categorical data with rectangular bars, where the length of each bar is proportional to the value it represents. It is useful for comparing discrete categories or groups of data.
- MULTI BAR GRAPH - Used to compare multiple categories in a single visualization.
- KEY INSIGHT - Shows the cumulative count of a metric over time.
Filters
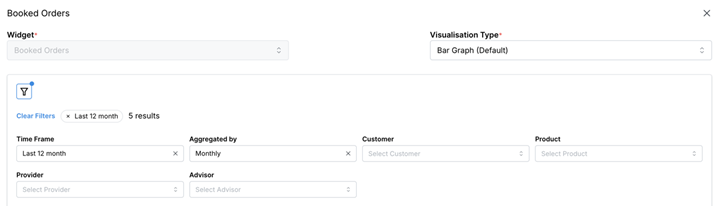
AppInsights offers multiple filters for each Insight, allowing users to customize and refine the data displayed. These filters can be accessed while configuring an Insight through the Add Insight or Edit Insight options.
📝 Note: Filters are interdependent, selecting one filter may impact the options available in others. The values selected in a filter are saved and you can no longer choose any new values in the filter till you reset the filter.
Time frame
The Time Frame filter defines the period for which the Insight is rendered. This filter corresponds to the date column of the Insight and allows users to focus on data from a specific time period.
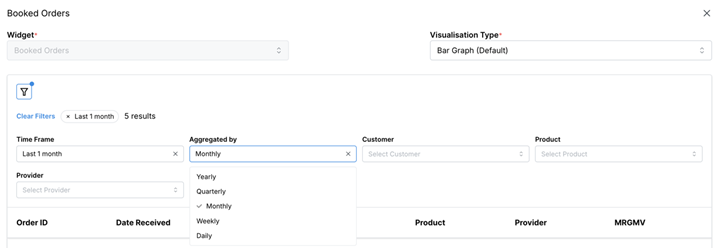
Aggregated By
The Aggregated By filter groups data within the Insight. For example:
- Selecting Monthly will display the graph grouped by months.
- Selecting Quarterly will display the graph grouped by quarters.
❗ Important: The Aggregated By filter only affects how the graph within the Insight is rendered. It does not influence the data displayed in the data table.
View insight data
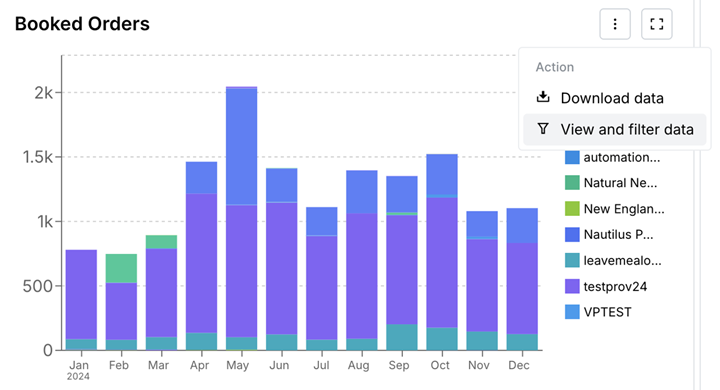
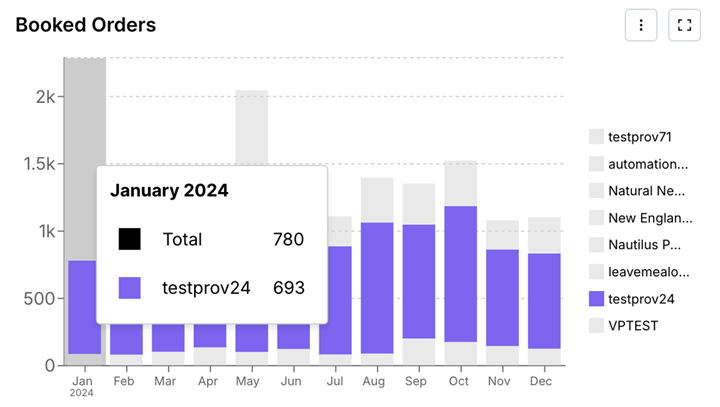
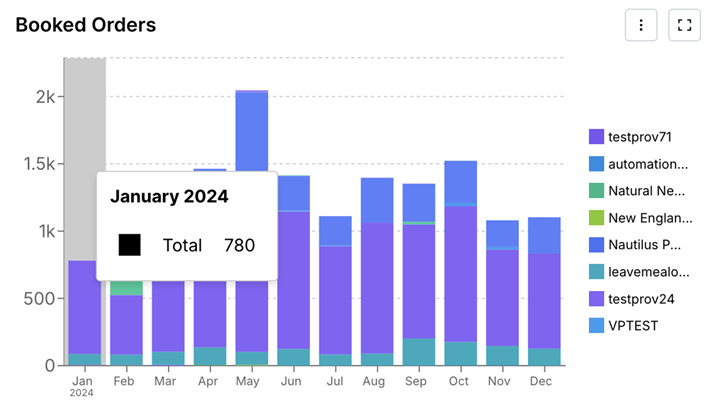
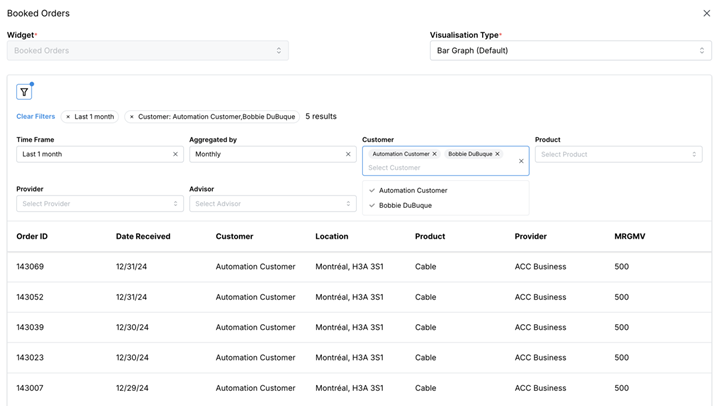
To view the underlying data within Insights you can drill down the widgets. You can view the data in the following ways:
-
From the action menu, click View and Filter Data to see the data for the entire Insight.
-
Click on a visualization segment to see the data for that legend item and time frame combination.
-
Click on the shadow behind a visualization segment, if available, to see the data for that time frame.
❗ Important: The drillability feature provides a view-only interface to explore the data behind the Insights. Any changes made within this view will not be saved to the Insight. To make updates to an Insight, see Edit Insight section.
Download insight data
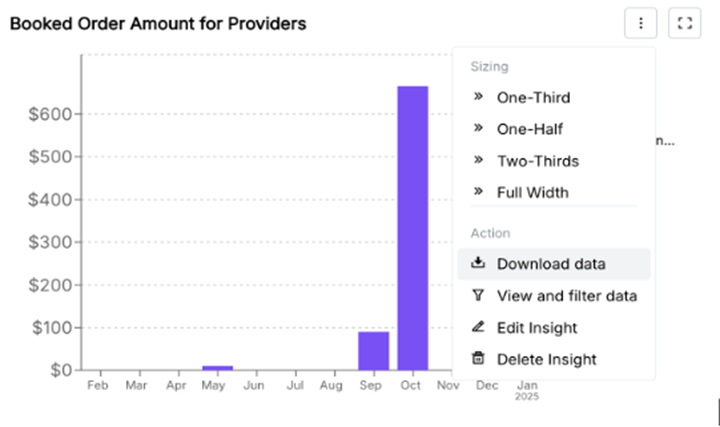
You can download the insights data in any of the following ways:
-
You can filter and download the data from the data table that opens when you drill an insight.
-
You can download the data for any insight from the action menu of the insight.
Edit insight
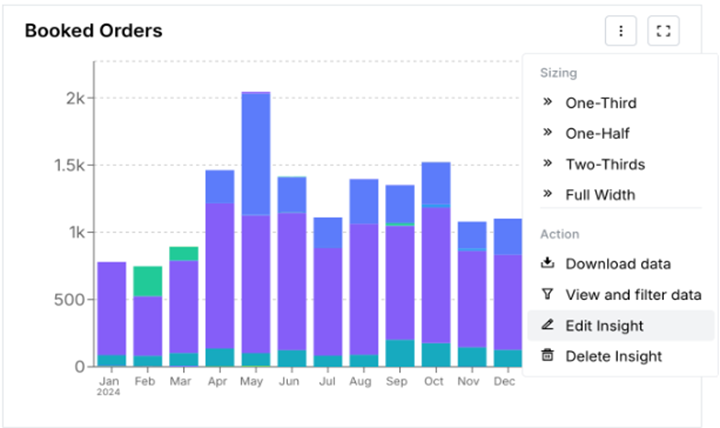
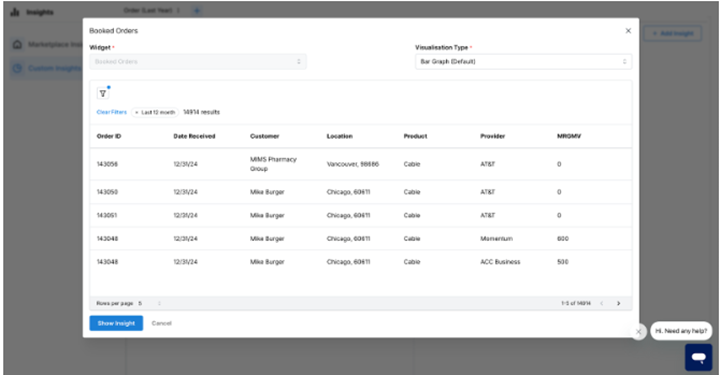
You can edit any insight on the custom-created dashboards from the action menu of the insight.
To edit insights:
-
Click the action menu of the insight.
-
Select Edit Insight.
-
Make the desired updates, and click on Show Insight to render the updated Insight.
Rename insight
You can rename any insight on the custom-created dashboards by doing any of the following:
-
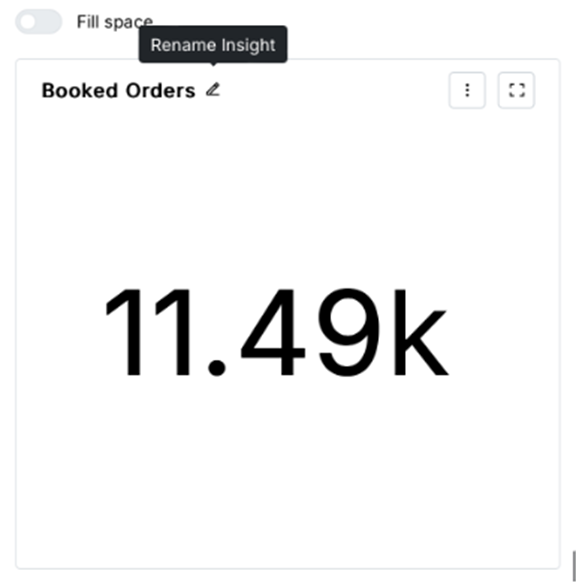
Click the pencil icon next to the insight name.
-
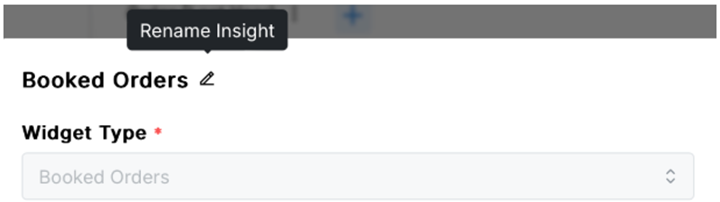
Go to the action menu of the insight, select Edit Insight and click the pencil icon next to the insight name.
Delete insight
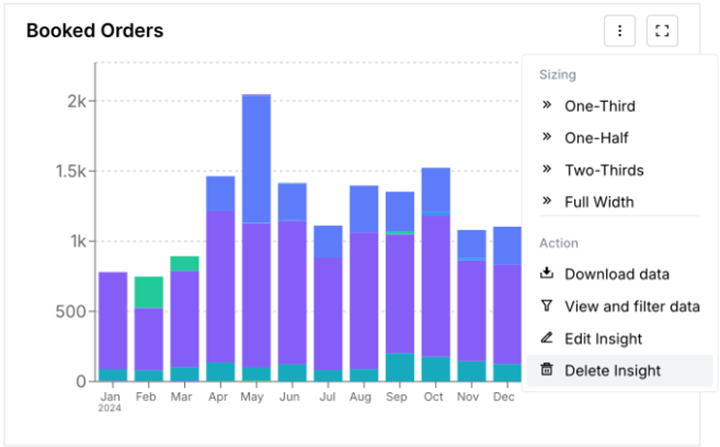
You can delete any insight on the custom-created dashboards from the action menu.
Fill Space
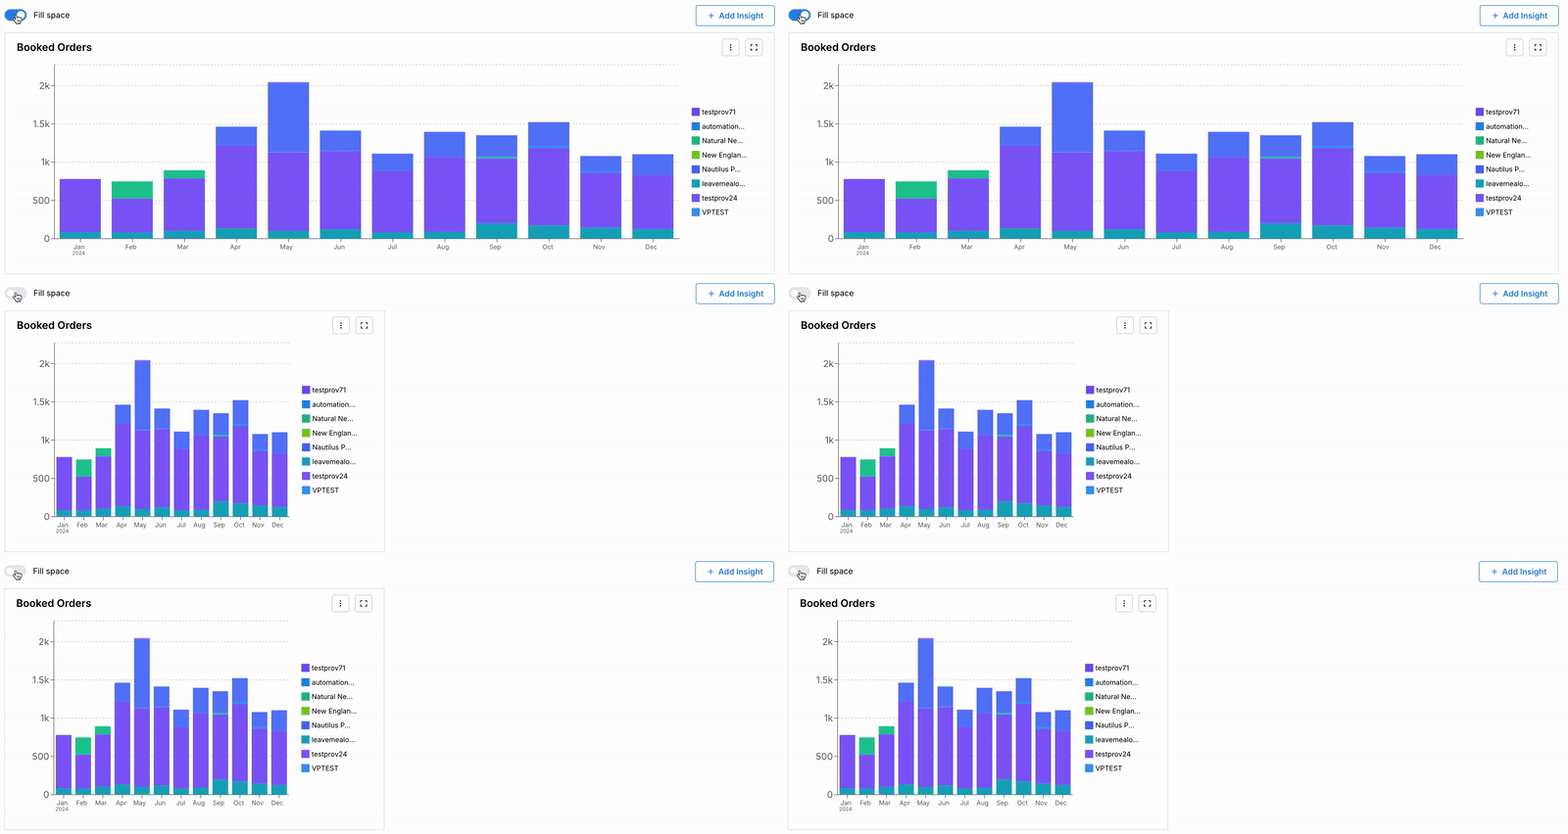
To expand the Insight to fill the entire row click Fill Space under Custom Insights.
Fullscreen
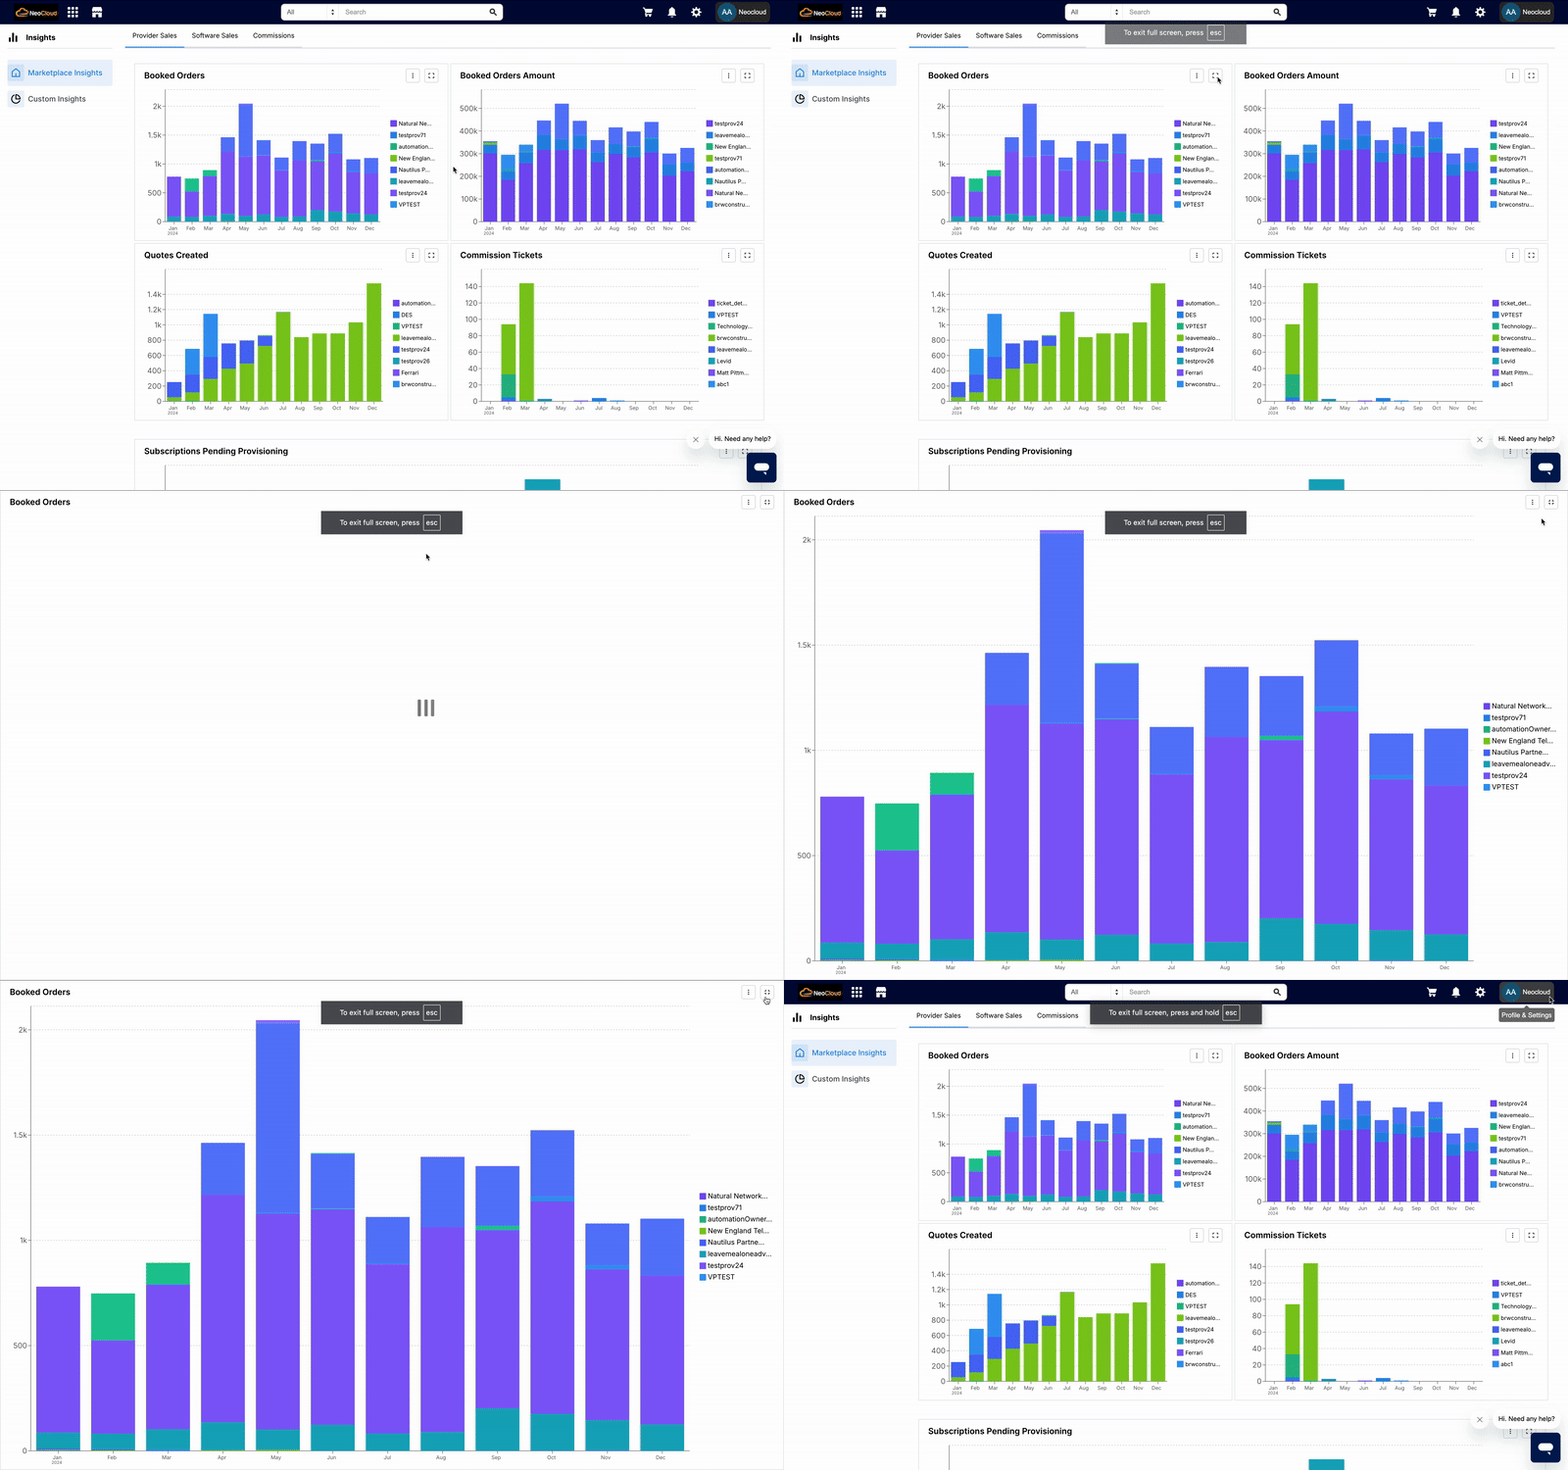
- You can maximize a widget by hovering over it and clicking the maximize icon on the top right corner of the widget.
- You can exit fullscreen mode by clicking the minimize icon.
Delete Dashboards
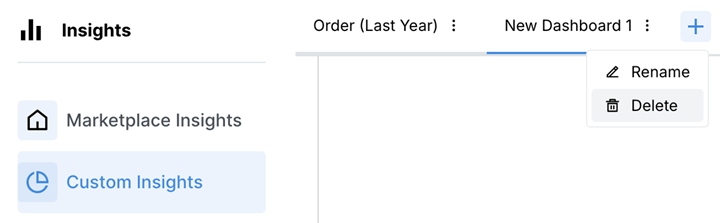
You can delete a dashboard by navigating to the action menu next to the dashboard name and selecting Delete.
Insights view for L1 advisor
-
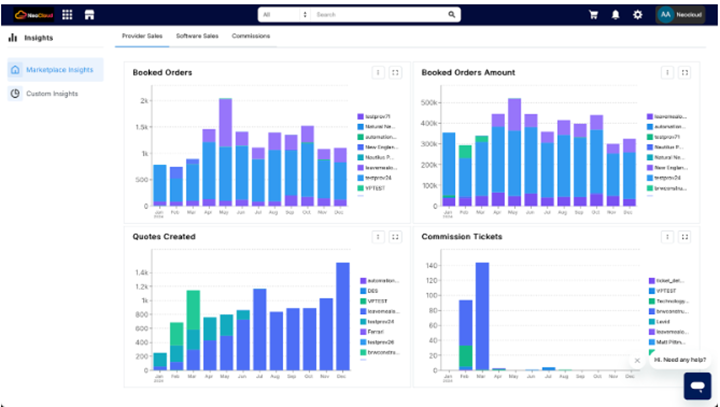
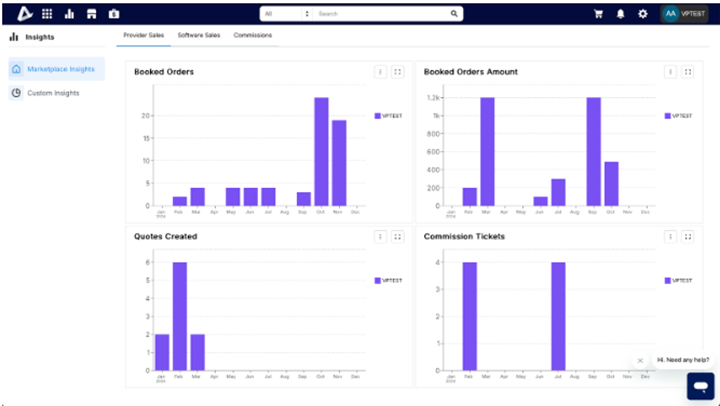
The L1 advisors can now view the data for themselves and their associated companies, presented through the bar graphs.
-
The Bar Graph widgets for an L1 advisor display data for both their company and all associated L2 companies. All other widgets only show data for the advisor’s own company.
View for L1 company
View for L2 company
Was this page helpful?
Tell us more…
Help us improve our content. Responses are anonymous.
Thanks
We appreciate your feedback!