Improvements to custom widgets in AppInsights
Moderate Upgrade
This feature is currently being released to sandbox marketplaces. Expected production announcement: release 758 on November 11, 2026. Dates may change based on validation results.
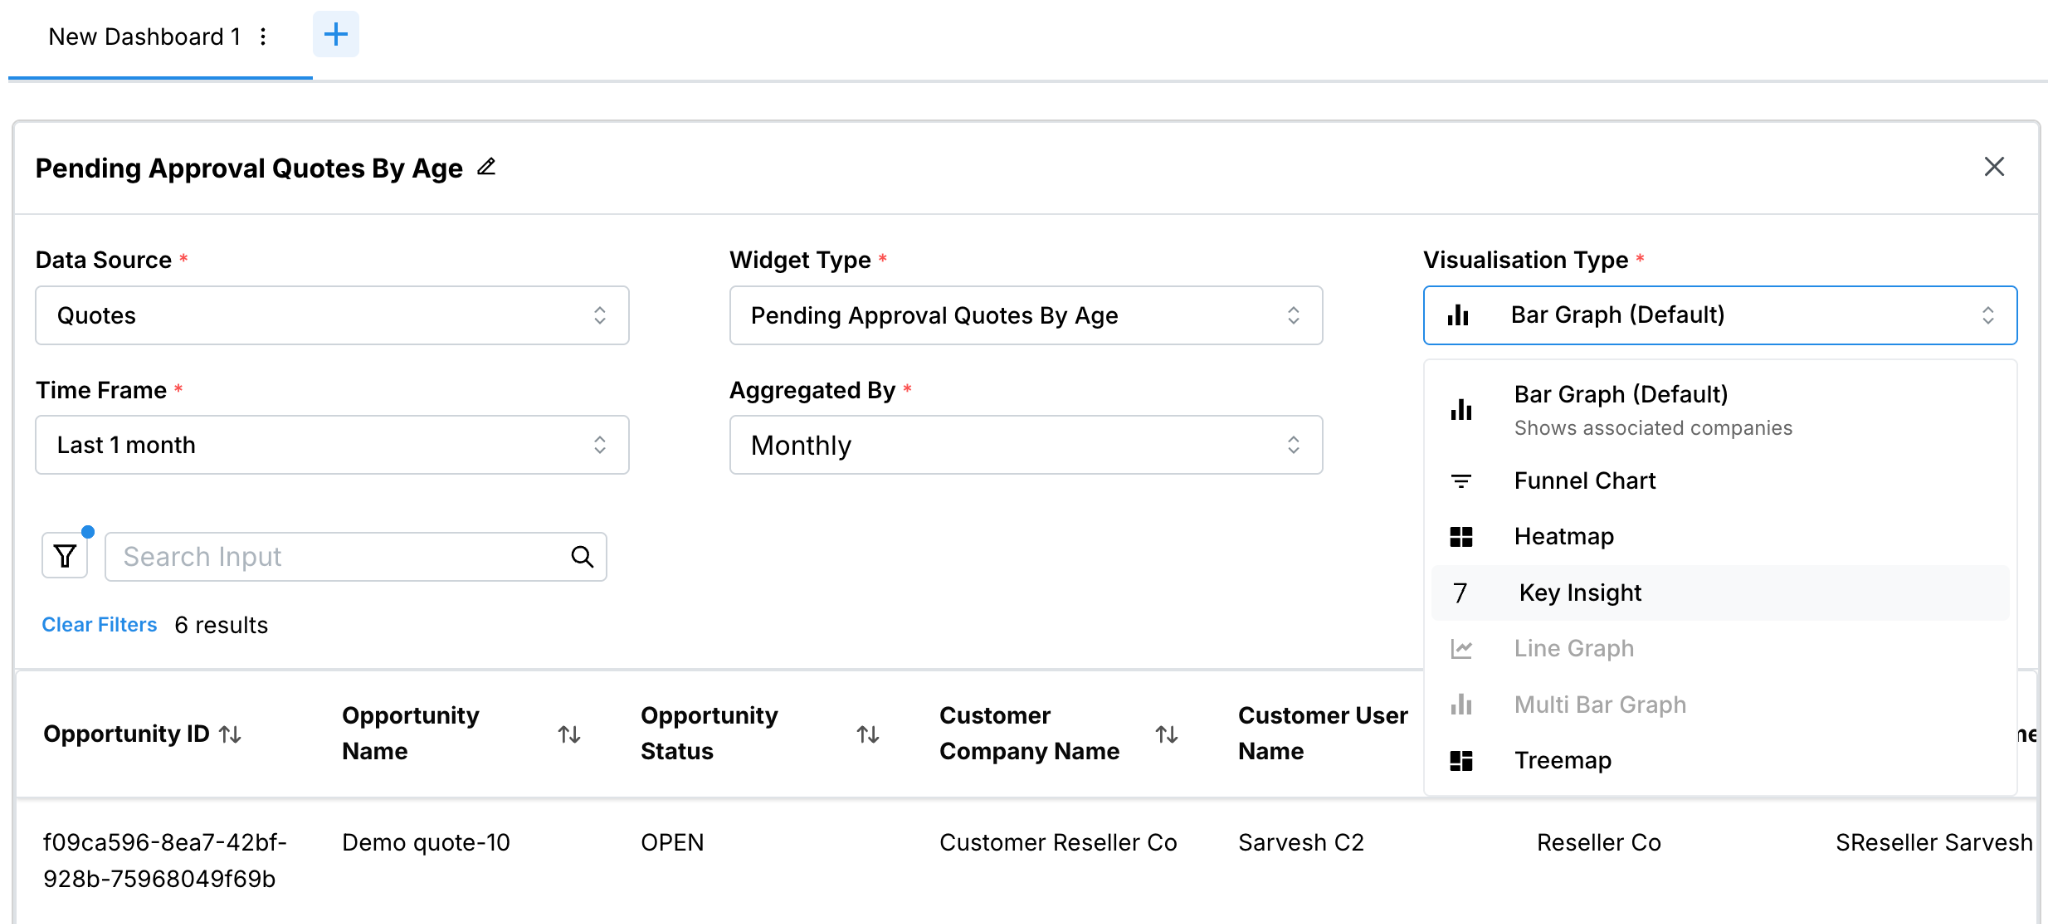
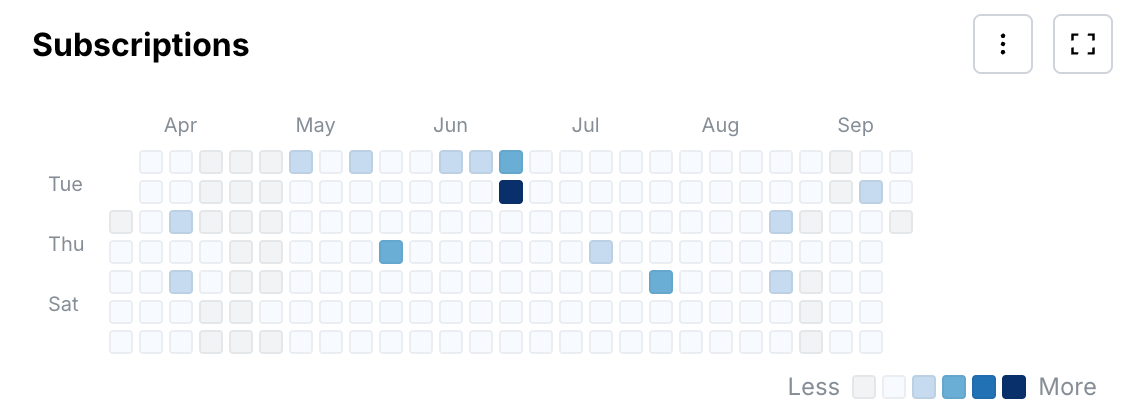
Users who can create custom AppInsights visualizations can now choose a data source first, then configure the measure and chart type for that source. Heatmap, Treemap, and Funnel visualizations are also available in the builder.
Previously, custom widget creation started from metric selection without an explicit data source step. Visualization options were limited to existing chart types such as table, bar, line, and pie.
New creation flow
- Choose a data source (for example Orders, Quotes, Subscriptions, Commissions, Revenue, Users, Invoices, or Companies). Availability depends on the role.
- Configure the measure (widget type). The Widget Type list is available only after a data source is selected and shows metrics for that source.
- Choose a visualization, including Heatmap, Treemap, and Funnel in addition to existing types.
- Continue configuration as today (fields, group-by, and filters as supported).
New visualization types
| Visualization type | Description |
|---|---|
| Heatmap | Default aggregation is daily |
| Treemap | Default aggregation is monthly |
| Funnel | Default aggregation is monthly |
Prerequisites
None.
Feature enablement
This feature is enabled by default. Users must already have access to create custom visualizations.
Setting enablement
No setting enablement is required.
Documentation
Documentation will be updated with the release. See Use AppInsights.
Was this page helpful?
Tell us more…
Help us improve our content. Responses are anonymous.
Thanks
We appreciate your feedback!